

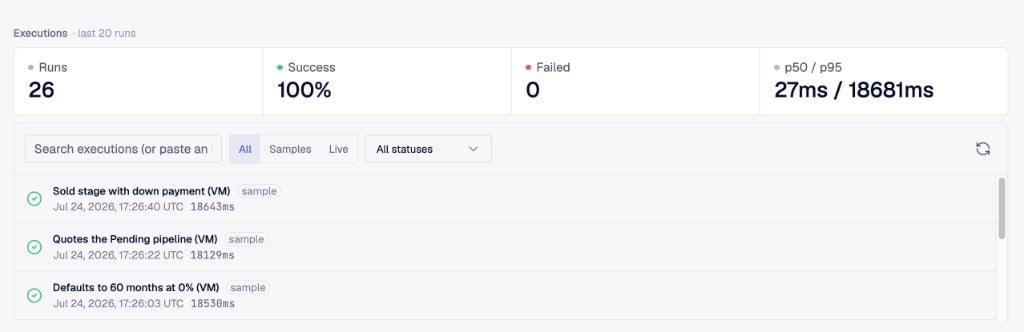
Sample runs and live runs
Sample runs come from teaching: the builder running samples during a build, or you clicking Run this sample or Run all samples on the job. Live runs come from real traffic at the trigger URL. They are the same machinery; the filter exists so a burst of sample runs does not bury your production history. Running all samples produces a run report: every scenario, every sample, pass or fail, in one place. It is the fastest way to answer “does this job still work?” after anything changes.Replays
The replay is the recording of the desktop during the run. Automation failures are usually visual: a dialog that appeared, a field that did not populate, a click that landed on the wrong row. Watching the replay is almost always the fastest way to see what actually happened, faster than reading logs. A replay of a live run: the job opens the customer list in a legacy dealership system, fills the new customer form from the request payload, and saves. The record count in the corner ticks up when the write lands. When a run fails:- Open the execution from the job page.
- Check which step failed and what its output was.
- Watch the replay around that step.
- Teach the job the failing case as a new sample, or drill down and fix the step yourself.
Reading a replay
Here is a live run that pulls a report out of a dealership management system and returns the rows as JSON. The whole run takes seven seconds. We ran the recording through the platform’s video analysis, the same tool agents use through the MCP, and drew its layers onto the video: the banner names the step that was executing at that moment, the green boxes are the screen regions the analysis detected changing, and the orange ring is the click it inferred from the cursor’s path. The run has three steps. Watch it once, then walk through the key moments. The frames carry the same layers as the video, drawn at the instant each event fired: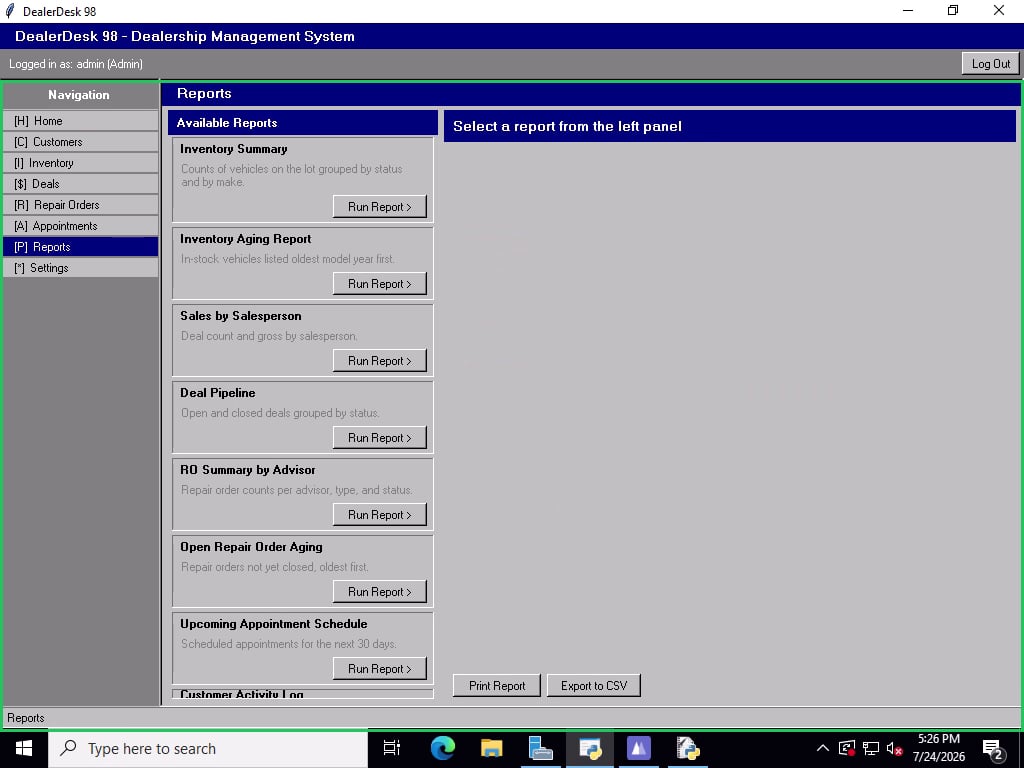
Step 1, Navigate to Reports. The green box is the screen change the analysis detected: the work area transitioning to the Reports screen, report pane empty and waiting.
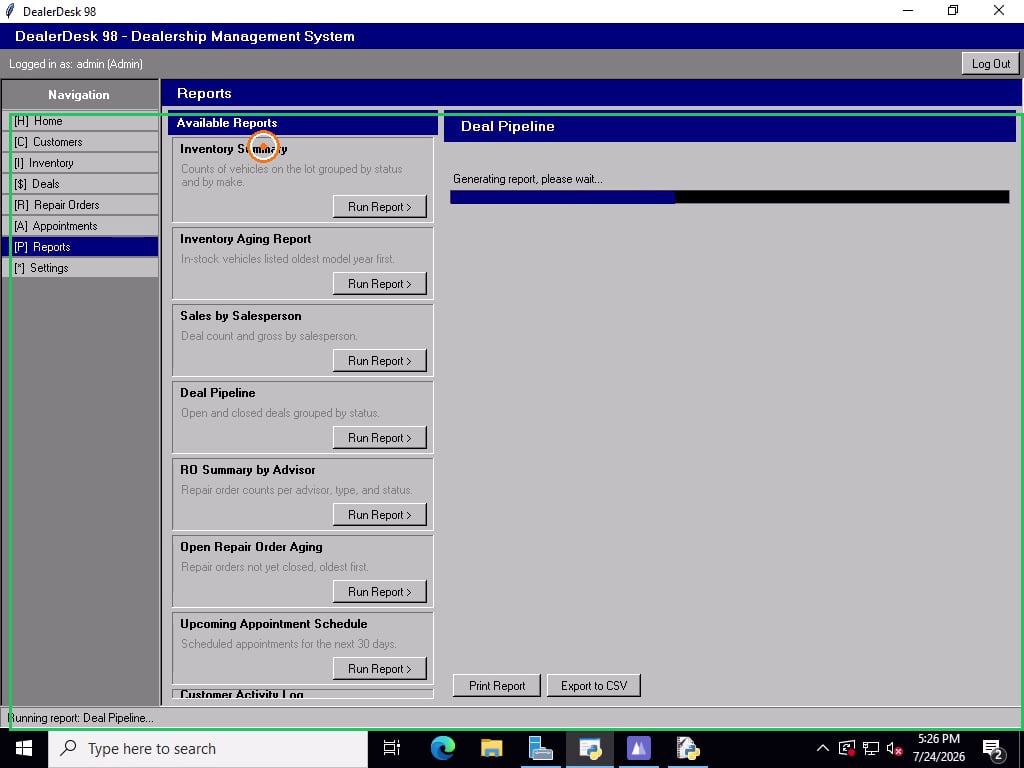
Step 2, Run the report. The orange ring is the click the analysis inferred from the cursor's path, and the green box is the region redrawing as the Deal Pipeline report generates.
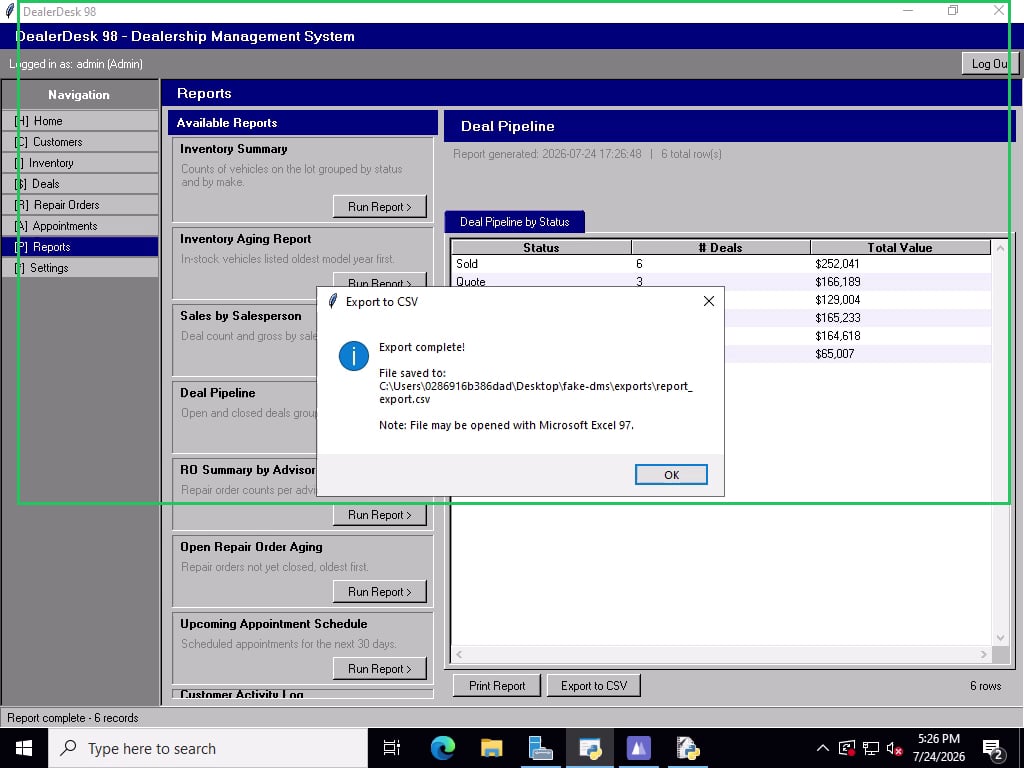
Still step 2. The automation clicked Export to CSV and the confirmation dialog shows exactly where the file landed on the desktop's disk. The box marks the next change the analysis caught: the dialog being dismissed.
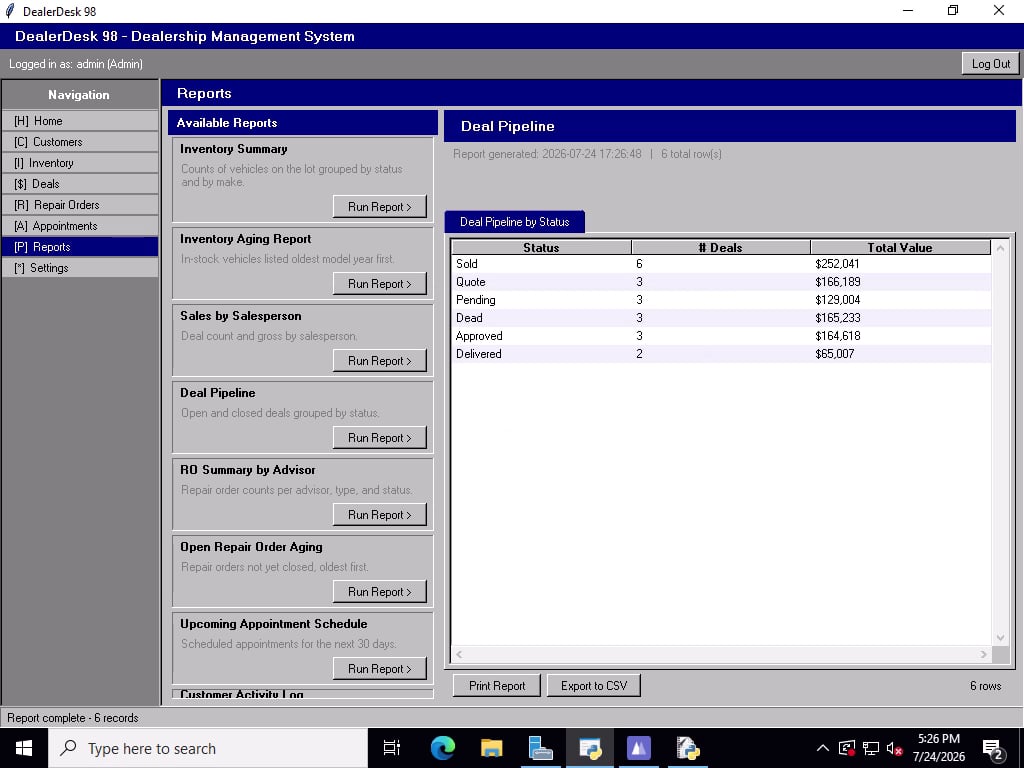
Step 3, Read the file. The dialog is gone; the automation reads the exported CSV from disk and returns the rows as structured JSON in the job's response.
Replays double as your audit trail. For every write into a system of record, there is a replay of it being made.